In 2018, the statistical bulletin on the development of China’s health care industry was released, with a lot of information!
Core reading guide
On May 22nd, the National Health and Wellness Commission issued the Statistical Bulletin on the Development of Health and Wellness in China in 2018. According to the Bulletin, the average life expectancy of Chinese residents has increased from 76.7 years in 2017 to 77 years in 2018, the maternal mortality rate has dropped from 19.6/100,000 to 18.3/100,000, and the infant mortality rate has dropped from 6.8‰ Down to 6.1‰ .
According to the Bulletin, in 2018, the total number of outpatients nationwide increased by 130 million person-times or 1.6% over the previous year. The average number of visits by residents increased from 5.9 in 2017 to 6.0. The total number of hospitalizations nationwide increased by 4.2% over the previous year. The annual hospitalization rate increased from 17.6% in 2017 to 18.2%. The number of beds in medical and health institutions per thousand population increased from 5.72 in 2017 to 6.03. By the end of 2018, the total number of medical and health institutions nationwide reached 997,434, an increase of 10,785 over the previous year. In addition, in 2018, private hospitals accounted for 63.5% of the total number of hospitals, an increase of 3.1 percentage points over the previous year. The proportion of outpatients and inpatients in private hospitals increased from 14.2% and 17.6% in 2017 to 14.8% and 18.3% respectively. By the end of 2018, the total number of health workers in the country reached 12.3 million, an increase of 551,000 (an increase of 4.7%) over the previous year.
It is worth noting that in 2018, the outpatient service of township hospitals and community health service centers (stations) increased by 2.1% compared with the previous year, accounting for 23.1% of the total outpatient service in the country. By the end of 2018, there were 622,000 village clinics in 542,000 administrative villages nationwide. The number of village clinics reached 1.441 million, with an average of 2.32 per village clinic. At the same time, the average cost increase of public hospitals has been controlled within 4% for three consecutive years. In 2018, the average outpatient expenses and per capita hospitalization expenses of public hospitals increased by 3.7% and 2.2% respectively over the previous year, which was lower than the average increase of 1.0 percentage points and 0.2 percentage points of hospitals, and lower than the increase of per capita disposable income of urban residents (5.6%) and per capita net income of rural residents (6.6%) in 2018.
According to preliminary calculations, the proportion of personal health expenditure in the total health expenditure in 2018 decreased by 0.04 percentage points compared with the previous year, and the proportion of total health expenditure in GDP increased by 0.03 percentage points compared with 2017. In terms of health manpower structure, at the end of 2018, there were 2.59 licensed (assistant) doctors and 2.94 registered nurses per 1,000 population, an increase of 0.15 and 0.20 respectively over the previous year. The educational level of health technicians has been further improved, accounting for 36.5% of the total, up 2.5 percentage points over the previous year; Senior technical positions (employment) accounted for 8.1%, an increase of 0.3 percentage points over the previous year.
According to the Bulletin, the population born in 2018 was 15.23 million, and the proportion of two children remained at around 50%.
The full text of the document is as follows:
2018 is the first year to fully implement the spirit of the 19th National Congress of the Communist Party of China. The national health system resolutely implements the decision-making arrangements of the CPC Central Committee and the State Council, makes every effort to promote the construction of a healthy China, continues to deepen the reform of the medical and health system, continuously enhances the capabilities of disease prevention and control and medical services, steadily advances the work of population development, maternal and child health and healthy aging, strengthens the service of traditional Chinese medicine, continuously improves the comprehensive supervision level, and continuously improves the health level of urban and rural residents. The average life expectancy of residents has increased from 76.7 years in 2017 to 77.0 years in 2018, the maternal mortality rate has decreased from 19.6/100,000 to 18.3/100,000, and the infant mortality rate has decreased from 6.8‰ Down to 6.1‰ .
01
I. Health resources
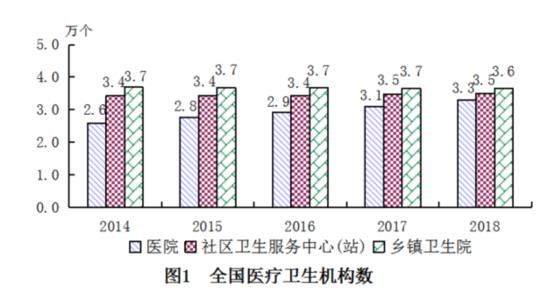
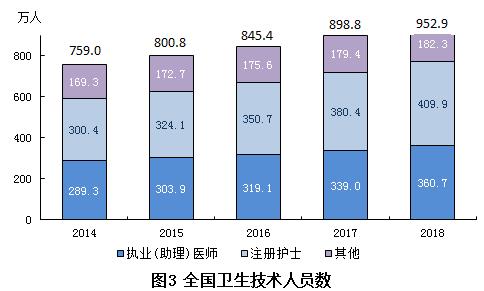
(1) The total number of medical and health institutions. By the end of 2018, the total number of medical and health institutions nationwide reached 997,434, an increase of 10,785 over the previous year. Among them, there are 33,009 hospitals, 943,639 primary medical and health institutions and 18,034 professional public health institutions. Compared with the previous year, there were 1,953 hospitals, 10,615 primary medical and health institutions and 1,862 professional public health institutions.
Among hospitals, there are 12,032 public hospitals and 20,977 private hospitals. Hospitals are classified into 2,548 tertiary hospitals (including 1,442 tertiary hospitals), 9,017 secondary hospitals, 10,831 first-class hospitals and 10,613 unrated hospitals. According to the number of beds, there are 20054 hospitals with less than 100 beds, 4786 hospitals with 100-199 beds, 4437 hospitals with 200-499 beds, 1858 hospitals with 500-799 beds and 1874 hospitals with 800 beds or more.
Among the primary medical and health institutions, there are 34,997 community health service centers (stations), 36,461 township health centers, 228,019 clinics and clinics and 622,001 village clinics. The government runs 121,918 primary medical and health institutions.
Among professional public health institutions, there are 3,443 centers for disease prevention and control, including 31 at the provincial level, 417 at the city (prefecture) level and 2,758 at the county (district, county-level city) level. There are 2949 health supervision institutions, including 29 at the provincial level, 392 at the city (prefecture) level and 2515 at the county (district, county-level city) level. There are 3080 maternal and child health care institutions, including 26 at the provincial level, 381 at the city (prefecture) level and 2571 at the county (district, county-level city) level.
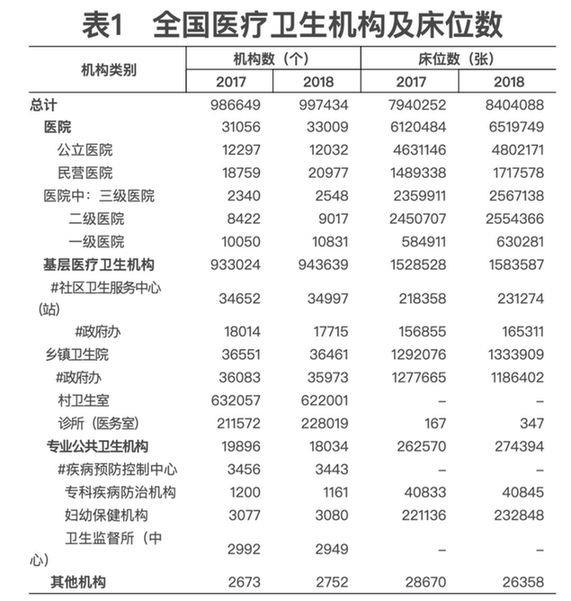
(2) Number of beds. By the end of 2018, there were 8.404 million beds in medical and health institutions nationwide, including 6.52 million beds in hospitals (accounting for 77.6%) and 1.584 million beds in primary medical and health institutions (accounting for 18.8%). In hospitals, public hospital beds account for 73.7% and private hospital beds account for 26.3%. Compared with the previous year, the number of beds increased by 464,000, including 399,000 beds in hospitals and 55,000 beds in primary medical and health institutions. The number of beds in medical and health institutions per thousand population increased from 5.72 in 2017 to 6.03 in 2018.
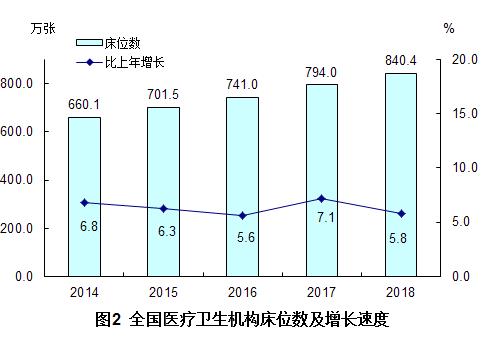
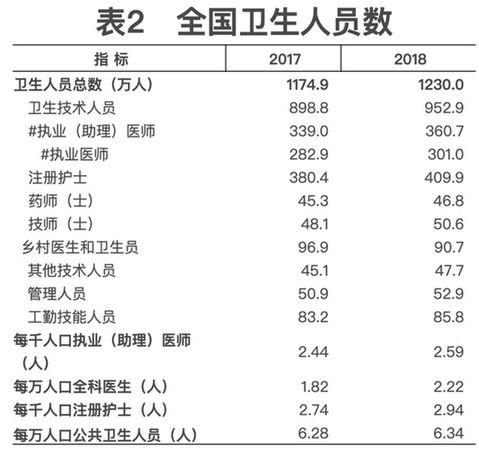
(3) Total number of health personnel. By the end of 2018, the total number of health workers in the country reached 12.3 million, an increase of 551,000 (an increase of 4.7%) over the previous year.
At the end of 2018, among the total number of health workers, there were 9.529 million health technicians, 907,000 rural doctors and health workers, 477,000 other technicians, 529,000 managers and 858,000 workers and technicians. Among the health technicians, there are 3.607 million licensed (assistant) doctors and 4.099 million registered nurses. Compared with the previous year, the number of health technicians increased by 541,000 (an increase of 6.0%) (see Table 2).
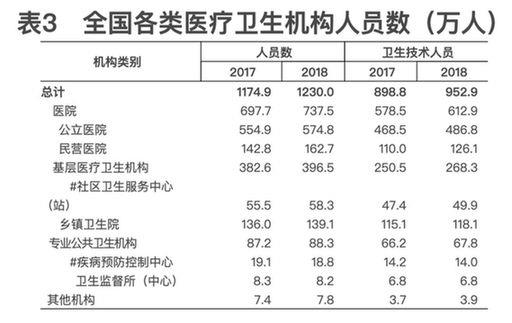
By the end of 2018, there were 7.375 million people in hospitals (accounting for 60.0%), 3.965 million people in primary medical and health institutions (accounting for 32.2%) and 883,000 people in professional public health institutions (accounting for 7.2%) (see Table 3).
At the end of 2018, the academic structure of health technicians: undergraduate and above accounted for 34.6%, junior college accounted for 37.8%, technical secondary school accounted for 22.3%, and high school and below accounted for 5.4%; Technical post (employment) structure: senior (director and deputy director level) accounts for 8.0%, intermediate (attending and supervisor) accounts for 19.9%, junior (division and bachelor level) accounts for 61.1%, and pending employment accounts for 10.9%.
In 2018, there were 2.59 licensed (assistant) doctors and 2.94 registered nurses per 1,000 population; There are 2.22 general practitioners per 10,000 population and 6.34 professional public health institutions per 10,000 population.
Note: The number of health workers and health technicians, including civil servants, who have obtained the "certificate of health supervisor". The following table is the same.
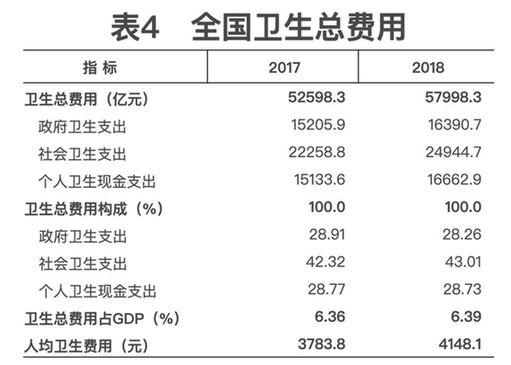
(4) Total health expenditure. In 2018, the total national health expenditure is estimated to reach 5,799.83 billion yuan, including 1,639.07 billion yuan (accounting for 28.3%) for government health, 2,494.47 billion yuan (accounting for 4.3%) for social health and 1,666.29 billion yuan (accounting for 28.7%) for personal health. The per capita total health expenditure is 4,148.1 yuan, and the total health expenditure accounts for 6.4% of GDP (see Table 4).
02
Second, medical services
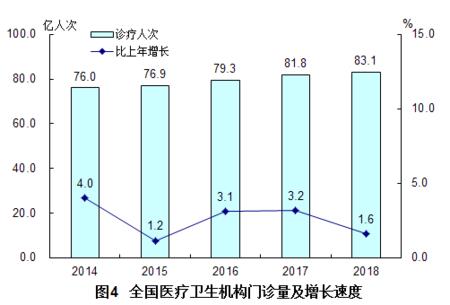
(1) Outpatient service and hospitalization. In 2018, the total number of medical consultations in medical and health institutions nationwide reached 8.31 billion, an increase of 130 million (1.6%) over the previous year. In 2018, residents visited medical and health institutions for an average of 6.0 times.
In 2018, there were 3.58 billion person-times in hospitals (accounting for 43.1%), 4.41 billion person-times in primary health care institutions (accounting for 53.1%) and 320 million person-times in other medical institutions (accounting for 3.9%). Compared with the previous year, the number of hospital visits increased by 140 million, and the number of primary medical and health institutions decreased by 20 million.
In 2018, there were 3.05 billion person-times in public hospitals (accounting for 85.2% of the total number of hospitals) and 530 million person-times in private hospitals (accounting for 14.8% of the total number of hospitals) (see Table 5).
In 2018, the number of outpatients in township hospitals and community health service centers (stations) reached 1.92 billion, an increase of 40 million over the previous year. Outpatients in township hospitals and community health service centers (stations) accounted for 23.1% of the total outpatient service, and the proportion increased by 0.1 percentage points over the previous year.
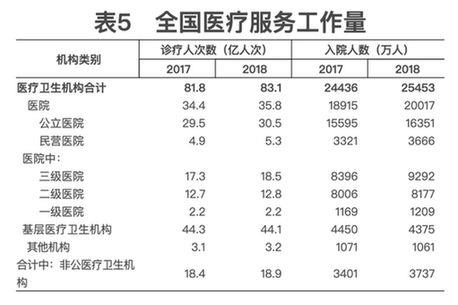
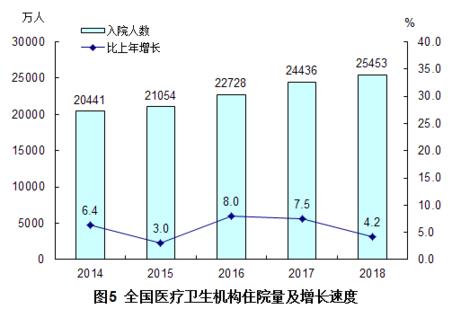
In 2018, there were 254.53 million people admitted to medical and health institutions nationwide, an increase of 10.17 million people (up 4.2%) over the previous year, and the annual hospitalization rate was 18.2%.
In 2018, there were 200.17 million people in hospitals (accounting for 78.6%), 43.75 million people in primary health care institutions (accounting for 17.2%) and 10.61 million people in other medical institutions (accounting for 4.2%). Compared with the previous year, the number of hospital admissions increased by 10.17 million, the number of primary medical and health institutions decreased by 750,000, and the number of other medical institutions decreased by 100,000.
In 2018, there were 163.51 million people admitted to public hospitals (accounting for 81.7% of the total number of hospitals) and 36.66 million people admitted to private hospitals (accounting for 18.3% of the total number of hospitals) (see Table 5).
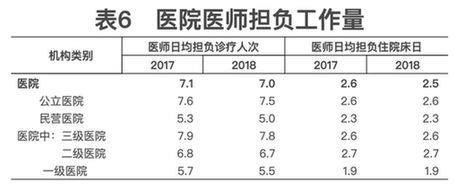
(2) The workload of hospital doctors. In 2018, hospital doctors were responsible for 7.0 person-times of medical treatment and 2.5 bed days of hospitalization, among which, doctors in public hospitals were responsible for 7.5 person-times of medical treatment and 2.6 bed days of hospitalization. The average daily workload of hospital doctors decreased slightly compared with the previous year (see Table 6).
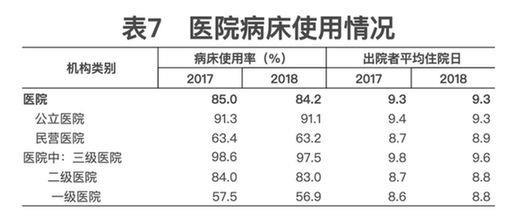
(3) use of hospital beds. In 2018, the utilization rate of hospital beds in China was 84.2%, including 91.1% in public hospitals. Compared with the previous year, the utilization rate of hospital beds decreased by 0.8 percentage points (including 0.2 percentage points in public hospitals). In 2018, the average length of stay of hospital discharged patients was 9.3 days (including 9.3 days in public hospitals), and the average length of stay of hospital discharged patients was the same as that of the previous year (see Table 7).
(4) improving medical services. By the end of 2018, among secondary and above public hospitals, 45.4% had made appointment for diagnosis and treatment, 90.8% had carried out clinical pathway management, 52.9% had carried out telemedicine services, 85.8% had participated in mutual recognition of examination results at the same level, and 70.9% had carried out quality nursing services.
(5) blood security. In 2018, the number of unpaid blood donors reached 14.99 million, and the amount of blood collected reached 25.695 million units, up by 2.8% and 3.7% respectively compared with 2017. The blood donation rate of thousands of people was close to 11.2.
03
Third, primary health services
(1) Rural health. By the end of 2018, there were 15,474 county-level hospitals, 1,907 county-level maternal and child health care institutions, 2,090 county-level centers for disease control and prevention, and 1,822 county-level health supervision institutions in 1,827 counties (county-level cities) across the country, and there were 3.039 million health workers in the four types of county-level health institutions.
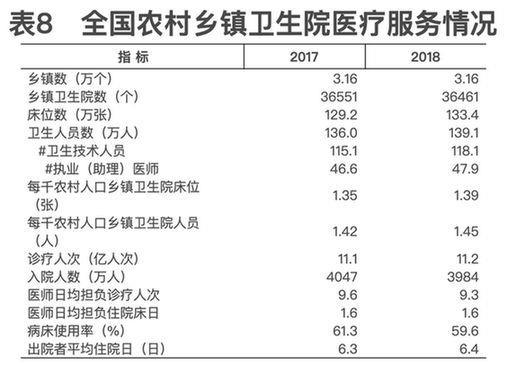
By the end of 2018, there were 36,000 township hospitals in 31,600 townships nationwide, with 1.334 million beds and 1.391 million health workers (including 1.181 million health technicians). Compared with the previous year, the number of township hospitals decreased by 90 (after the merger of towns and villages), the number of beds increased by 42,000, and the number of personnel increased by 31,000. In 2018, there were 1.39 beds in township hospitals per 1,000 rural population and 1.45 people in township hospitals per 1,000 rural population (see Table 8).
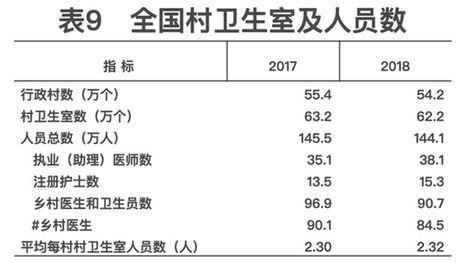
By the end of 2018, there were 622,000 village clinics in 542,000 administrative villages nationwide. There are 1.441 million village clinics, including 381,000 licensed (assistant) doctors, 153,000 registered nurses, and 907,000 rural doctors and health workers. The average number of clinic staff in each village is 2.32. Compared with the previous year, the number of village clinics decreased by 10,000, and the total number of staff decreased (see Table 9).
Note: The number of licensed (assistant) doctors and registered nurses in village clinics includes the number of township hospitals.
In 2018, the number of hospital visits at county level (including county-level cities) reached 1.19 billion, an increase of 50 million over the previous year; The number of people admitted to the hospital was 87.446 million, an increase of 3.804 million over the previous year; The utilization rate of hospital beds was 81.7%, down 0.3 percentage points from the previous year.
In 2018, the number of medical consultations in township hospitals was 1.12 billion, an increase of 0.1 billion over the previous year; The number of people admitted to the hospital was 39.84 million, a decrease of 630,000 over the previous year. In 2018, doctors were responsible for 9.3 person-times of diagnosis and treatment and 1.6 bed days of hospitalization. The utilization rate of hospital beds was 59.6%, and the average hospitalization days of discharged patients were 6.4 days. Compared with the previous year, the workload of doctors in township hospitals decreased slightly, the utilization rate of hospital beds decreased by 1.7 percentage points, and the average length of stay was extended by 0.1 days compared with the previous year.
In 2018, the amount of medical treatment in village clinics reached 1.67 billion person-times, a decrease of 120 million person-times compared with the previous year, with an average annual medical treatment of 2,685 person-times in each village clinic.
(2) Community health. By the end of 2018, there were 34,997 community health service centers (stations) in China, including 9,352 community health service centers and 25,645 community health service stations. Compared with last year, there were 205 community health service centers and 140 community health service stations. There are 462,000 people in community health service centers, with an average of 49 people in each center; There are 120,000 people in community health service stations, with an average of 5 people per station. The number of staff in community health service centers (stations) increased by 28,000 over the previous year, with an increase of 5.1%.
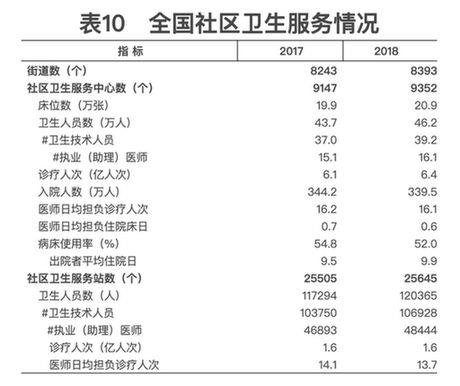
In 2018, there were 640 million medical consultations and 3.395 million hospitalizations in the national community health service centers, an increase over the previous year; On average, each center has an annual treatment volume of 68,000 person-times and an annual admission volume of 363 people. Doctors are responsible for 16.1 person-times of diagnosis and treatment and 0.6 days of hospitalization. In 2018, there were 160 million medical consultations in community health service stations nationwide, with an average of 6,244 medical consultations per station, and 13.7 medical consultations per doctor per day (see Table 10).
(3) National basic public health service projects. The per capita subsidy standard for national basic public health service projects increased from 52.6 yuan in 2017 to 57.6 yuan in 2018. Health literacy promotion and free provision of contraceptives were included in national basic public health service projects, and the project content was expanded from 12 categories to 14 categories.
04
Fourth, Chinese medicine services
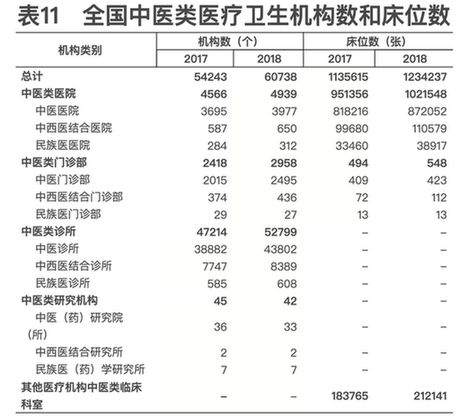
(a) institutions of traditional Chinese medicine, beds and personnel. By the end of 2018, the total number of Chinese medicine medical and health institutions nationwide reached 60,738, an increase of 6,495 over the previous year. Among them, there are 4,939 Chinese medicine hospitals, 55,757 Chinese medicine clinics and 42 Chinese medicine research institutions. Compared with the previous year, the number of Chinese medicine hospitals increased by 373, and the number of Chinese medicine clinics and clinics increased by 6,125 (see Table 11).
Note: Clinical departments of traditional Chinese medicine include various specialties of traditional Chinese medicine, integrated traditional Chinese and western medicine and ethnic medicine.
At the end of 2018, there were 1.234 million beds in Chinese medicine medical and health institutions nationwide, including 1.022 million beds in Chinese medicine hospitals (82.8%). Compared with the previous year, there were 99,000 beds in Chinese medicine, including 70,000 beds in Chinese medicine hospitals.
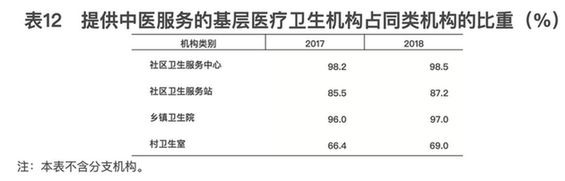
By the end of 2018, community health service centers providing Chinese medicine services accounted for 98.5% of similar institutions, community health service stations accounted for 87.2%, township hospitals accounted for 97.0%, and village clinics accounted for 69.0% (see Table 12).
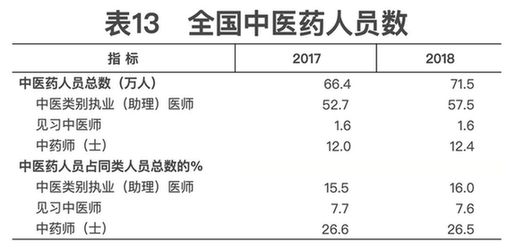
At the end of 2018, the total number of Chinese medicine health personnel nationwide reached 715,000, an increase of 51,000 (an increase of 7.7%) over the previous year. Among them, there are 575,000 licensed (assistant) physicians and 124,000 Chinese pharmacists. The two types of personnel have increased compared with the previous year (see Table 13).
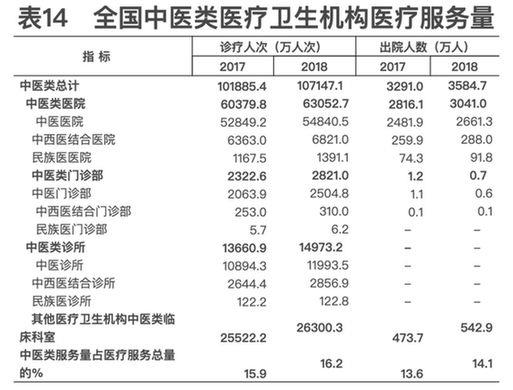
(2) Chinese medicine medical services. In 2018, the total number of medical consultations in Chinese medical and health institutions nationwide reached 1.07 billion, an increase of 50 million (5.2%) over the previous year. Among them, there were 630 million person-times in TCM hospitals (accounting for 58.8%), 180 million person-times in TCM outpatient departments and clinics (accounting for 16.6%), and 260 million person-times in TCM clinical departments of other medical institutions (accounting for 24.5%).
In 2018, there were 35.847 million people discharged from Chinese medical and health institutions nationwide, an increase of 2.937 million (8.9%) over the previous year. Among them, there are 30.41 million Chinese medicine hospitals (accounting for 84.8%), 7,000 Chinese medicine clinics and 5.429 million Chinese medicine clinical departments in other medical and health institutions (accounting for 15.1%) (see Table 14).
V. Medical expenses of patients
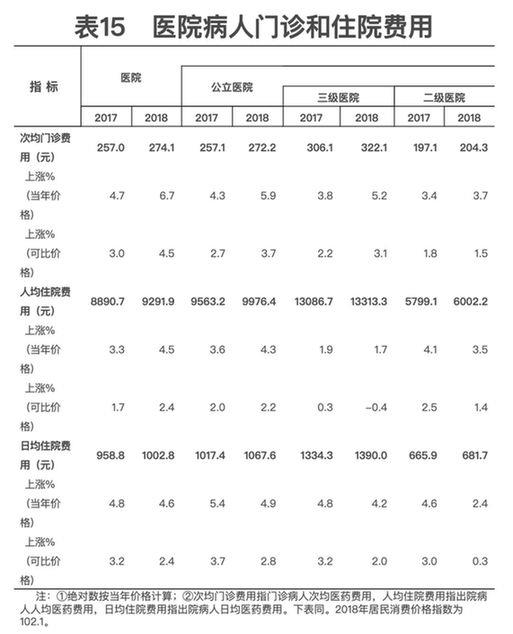
(1) Medical expenses of hospital patients. In 2018, the average outpatient cost of the hospital was 274.1 yuan, which was 6.7% higher than that of the previous year and 4.5% higher than the comparable price. The per capita hospitalization expense is 9291.9 yuan, which is 4.5% higher than that of the previous year and 2.4% higher than that of the comparable price. The average daily hospitalization expense is 1002.8 yuan (see Table 15).
In 2018, the average outpatient drug cost (112.0 yuan) accounted for 40.9%, down 1.8 percentage points from the previous year (42.7%); The per capita hospitalization expenses (2621.6 yuan) accounted for 28.2%, which was 2.9 percentage points lower than the previous year (31.1%).
In 2018, among public hospitals at all levels, the average outpatient expenses of tertiary hospitals increased by 5.2% (the current price, the same below), and the per capita hospitalization expenses increased by 1.7%, which was lower than the increase in patient expenses of public hospitals (see Table 15).
(2) Medical expenses of patients in primary medical and health institutions. In 2018, the average outpatient cost of community health service centers was 132.3 yuan, up 13.1% from the previous year and 10.8% from comparable prices. The per capita hospitalization expense is 3,194.0 yuan, which is 4.4% higher than that of the previous year and 2.3% higher than the comparable price (see Table 16).
In 2018, the average outpatient drug cost of community health service centers (90.5 yuan) accounted for 68.4%, down 0.3 percentage points from the previous year (68.7%); The per capita hospitalization expenses (1,169.6 yuan) accounted for 36.6%, which was 2.9 percentage points lower than the previous year (39.5%).
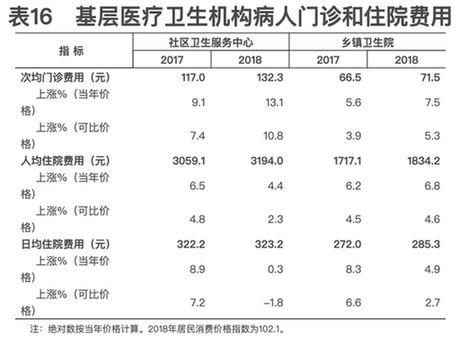
In 2018, the average outpatient fee of township health centers was 71.5 yuan, which was 7.5% higher than that of the previous year and 5.3% higher than the comparable price. The per capita hospitalization expense is 1,834.2 yuan, which is 6.8% higher than that of the previous year and 4.6% higher than the comparable price. The average daily hospitalization expense is 285.3 yuan.
In 2018, the average outpatient drug cost of township hospitals (39.3 yuan) accounted for 55.0%, up 0.6 percentage points from the previous year (54.4%); The per capita hospitalization expenses (730.7 yuan) accounted for 39.8%, which was 2.4 percentage points lower than the previous year (42.2%).
06
VI. Disease Control and Public Health
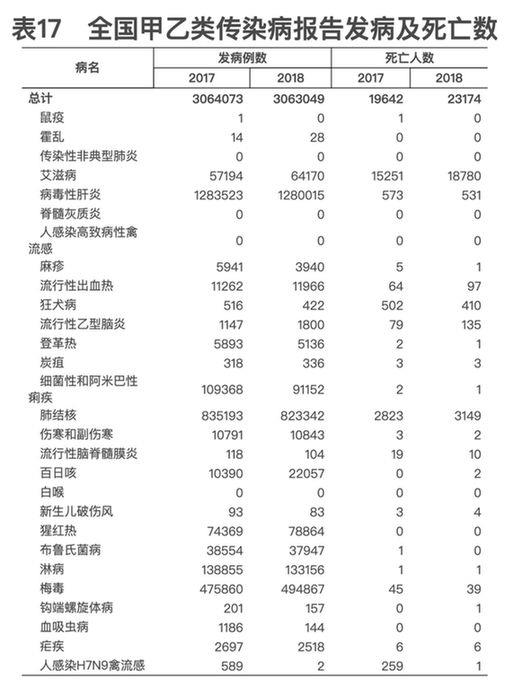
(a) reported incidence and death of infectious diseases. In 2018, 3.063 million cases of Class A and B infectious diseases were reported and 23,174 people died. The top five reported cases are viral hepatitis, tuberculosis, syphilis, gonorrhea, bacterial and amebic dysentery, accounting for 92.2% of the total reported cases of Class A and B infectious diseases. The top five reported deaths are AIDS, tuberculosis, viral hepatitis, rabies and Japanese encephalitis, accounting for 99.3% of the total reported deaths of Class A and B infectious diseases (see Table 17).
In 2018, the reported incidence rate of Class A and B infectious diseases in China was 2.20.5/100,000, and the mortality rate was 1.7/100,000.
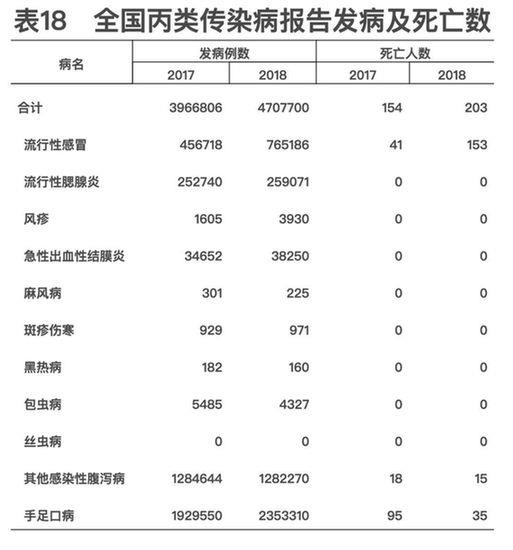
In 2018, except for filariasis, there were no reported cases of morbidity and mortality of Class C infectious diseases in China, and the other 10 diseases reported a total of 4.708 million cases and 203 deaths. The top five reported cases were hand, foot and mouth disease, other infectious diarrhea, influenza, mumps and acute hemorrhagic conjunctivitis, accounting for 99.8% of the total reported cases of Class C infectious diseases. The diseases that reported more deaths were influenza, hand-foot-mouth disease and other infectious diarrhea in turn, accounting for 100% of the total reported deaths of Class C infectious diseases (see Table 18).
In 2018, the reported incidence rate of Class C infectious diseases in China was 3.38.9/100,000, and the mortality rate was 0.0146/100,000.
(2) Prevention and control of schistosomiasis. By the end of 2018, there were 450 schistosomiasis endemic counties (cities, districts) in China; The number of counties (cities, districts) that have achieved elimination, transmission blocking and transmission control is 263, 124 and 63 respectively; At the end of the year, there were 29,329 patients with advanced schistosomiasis, 78 fewer than the previous year.
(3) prevention and control of endemic diseases. By the end of 2018, there were 330 counties with Keshan disease in the country, with 238 eliminated and 73 controlled counties respectively, and there were 6600 patients. There are 379 counties with Kaschin-Beck disease, 346 counties have been eliminated and 21 counties have been controlled, with 177,000 patients. There are 2,829 counties harmed by iodine deficiency and 2,337 counties eliminated. There are 1049 endemic fluorosis (drinking water type) counties, 668 control counties, 80011 endemic villages, 13.333 million patients with dental fluorosis and 135,900 patients with skeletal fluorosis. There are 171 endemic fluorosis (coal-burning pollution) counties, 156 controlled counties, 13.776 million patients with dental fluorosis and 92,200 patients with skeletal fluorosis.
(4) Prevention and control of occupational diseases. By the end of 2018, there were 2,754 occupational health inspection institutions and 478 occupational disease diagnosis institutions nationwide. In 2018, a total of 23,497 new cases of various occupational diseases, 19,524 cases of occupational pneumoconiosis and other respiratory diseases (including 19,468 cases of occupational pneumoconiosis), 1,528 cases of occupational otorhinolaryngology and oral diseases, 1,333 cases of occupational chemical poisoning, 540 cases of occupational infectious diseases, 331 cases of occupational diseases caused by physical factors, 77 cases of occupational tumors, 93 cases of occupational skin diseases, 47 cases of occupational eye diseases and 17 cases of radiation-induced diseases were reported. As of 2018, the publicity week of the Law on the Prevention and Control of Occupational Diseases has been organized for 16 consecutive years, and the occupational health training project has been implemented. In the past 10 years, 4.3 million person-times of corporate leaders and occupational health managers have been trained.
07
Seven, maternal and child health and healthy aging
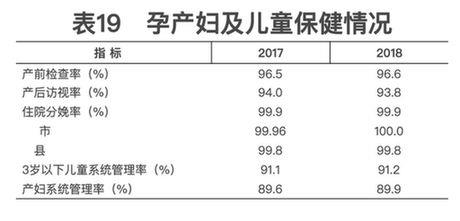
(1) Maternal and child health care. In 2018, the prenatal check-up rate of pregnant women was 96.6%, and the postpartum visit rate was 93.8%. Compared with the previous year, the rate of prenatal examination has increased and the rate of postpartum visit has decreased (see Table 19). In 2018, the hospital delivery rate was 99.9% (100.0% in the city and 99.8% in the county), which was the same as the previous year.
In 2018, the systematic management rate of children under 3 years old reached 91.2%, an increase of 0.1 percentage points over the previous year; The systematic management rate of pregnant and lying-in women reached 89.9%, an increase of 0.3 percentage points over the previous year (see Table 19).
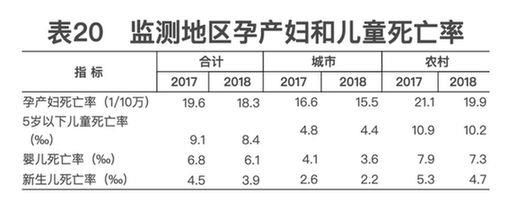
(2) Mortality rate of children under 5 years old. According to maternal and child health monitoring, in 2018, the mortality rate of children under 5 years old was 8.4‰ , in which: City 4.4‰ Rural 10.2‰ ; Infant mortality rate is 6.1‰ , in which: City 3.6‰ Rural 7.3‰ . Compared with the previous year, the mortality rate of children under 5 years old and the infant mortality rate have decreased in different degrees (see Table 20).
(3) Maternal mortality rate. According to maternal and child health monitoring, in 2018, the maternal mortality rate was 18.3/100,000, including 15.5/100,000 in cities and 19.9/100,000 in rural areas. Compared with the previous year, the maternal mortality rate has decreased (see table 20).
(4) National free pre-pregnancy eugenics program. All counties (cities, districts) in China generally carry out free pre-pregnancy eugenics health check-ups, and provide free pre-pregnancy eugenics services such as health education, health check-ups, risk assessment, consultation and guidance for rural planned pregnant couples. In 2018, a total of 11.31 million couples with planned pregnancy were provided with free check-ups, and the average coverage rate of the target population reached 88.4%. All the screened risk groups received targeted counseling and treatment referral services, and pre-pregnancy preventive measures were implemented, effectively reducing the risk of birth defects.
(5) Promoting the combination of health services and medical care for the elderly. In 2018, there were 6 national clinical medical research centers for geriatrics, 1,519 medical and health institutions with geriatrics, and 276 medical and health institutions with hospice care (hospice care). The elderly over 65 accounted for 29.2% of the total number of inpatients. The 13th Five-Year Plan for Healthy Ageing was successfully implemented. Piloting the combination of medical care and nursing care in 90 cities. Jointly with the Ministry of Industry and Information Technology and the Ministry of Civil Affairs, the second batch of smart and healthy old-age application demonstration work was carried out, and 26 demonstration enterprises, 48 demonstration streets (towns) and 10 demonstration bases were identified.
08
Eight, food safety and health supervision
(1) Food safety risk monitoring. According to the reports of provinces (autonomous regions and municipalities) and Xinjiang Construction Corps (the same below), by the end of 2018, there were 2,822 food safety risk monitoring points nationwide to monitor chemical pollutants and harmful factors in 135,000 samples of 26 categories; Monitoring points were set up in 62914 medical and health institutions to carry out food-borne disease monitoring.
(2) Health supervision in public places. In 2018, there were 1.232 million supervised units in public places nationwide, with 6.752 million employees. 1.735 million times of supervision and inspection were conducted in public places, and 82,000 cases were investigated and dealt with according to law.
(3) Sanitary supervision of drinking water. In 2018, there were 80,000 supervised units for drinking water sanitation (water supply) nationwide, and 445,000 people were directly engaged in water supply and management. Supervision and inspection of drinking water hygiene (water supply) was carried out for 134,000 times. There are 5,345 supervised units involving drinking water hygiene and safety products in China, with 114,000 employees. 6,470 households were supervised and inspected for products related to drinking water hygiene and safety. 4,244 cases of drinking water and drinking water safety products were investigated and dealt with according to law.
(four) disinfection products and tableware centralized disinfection hygiene supervision. In 2018, there were 5,894 supervised units in disinfection products, with 87,500 employees. Disinfection products has supervised and inspected 33,900 times, and sampled 4,037 pieces, with a qualified rate of 96.6%. 1,933 cases were investigated and dealt with according to law. In 2018, there were 4,262 centralized disinfection service units for tableware and drinking utensils nationwide, with 44,000 employees. 9,754 households were supervised and inspected, and 1,298 cases were investigated and dealt with according to law.
(5) School health supervision. In 2018, there were 197,000 supervised schools nationwide, with 272,000 supervision and inspections and 4,854 cases investigated.
(6) Occupational health and radiological health supervision of medical institutions. By the end of 2018, 3,392 households were actually supervised by occupational health, with a supervision coverage rate of 78.4%, and 5,616 households were regularly supervised. 136 occupational health cases were investigated and dealt with according to law. There were 53,000 actual radiation hygiene supervisors, with a supervision coverage rate of 86.0%, and 82,000 regular inspections were conducted. 6,159 radiation health cases were investigated and dealt with according to law.
(seven) health supervision of medical and health care, blood safety and prevention and treatment of infectious diseases. In 2018, 28,800 health administrative penalties were imposed on medical institutions or medical personnel according to law. Administrative punishment for practicing medicine without a license was 19,200. 122 administrative penalties were imposed on blood collection and supply institutions according to law. 53,000 cases of prevention and treatment of infectious diseases were investigated and dealt with according to law, including 53,000 cases of health administrative punishment.
(8) family planning supervision. In 2018, there were 20,200 family planning supervised units, 23,800 family planning supervision and inspections, and 1,026 cases were investigated and dealt with according to law.
09
IX. Population and family development
(a) the universal two-child policy steady implementation. In 2018, the birth population was 15.23 million, and the proportion of two children remained at around 50%, and the sex ratio continued to decline steadily. Maternal and child health services have been actively promoted, the whole-course maternity service has been strengthened, and the construction of maternal and child facilities has been solidly promoted. The allocation rate of public places that should be equipped with maternal and child facilities has reached 88.3%, and the phased goals have been successfully completed. Relevant departments have been coordinated to promote the matching of relevant economic and social policies such as nursery, preschool education, employment, housing and taxation with the birth policy.
(2) The reform of family planning service management was deepened. All localities actively promote the interconnection of family planning information, and carry out online registration, "multi-certificate integration", one-time registration and full-service service. The online birth registration rate exceeds 90%, achieving "running at most once". Carry out dynamic monitoring and investigation of floating population and actively promote the equalization of basic public health and family planning services for floating population.
(three) family planning incentives and support policies. In 2018, a total of 19.01 billion yuan was invested in the "three systems" of family planning incentives and assistance, an increase of 3.16 billion yuan over the previous year; The special support system for family planning benefited 1.247 million people, and the project of "having fewer children and getting rich quickly" in the western region benefited 19 thousand households.
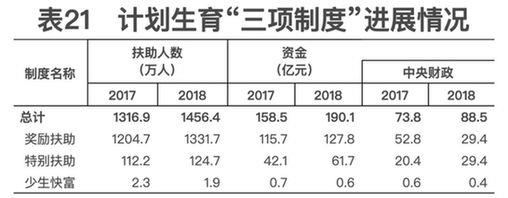
Note: The total number of people assisted does not include those who have fewer children and get rich quickly, and the number of people assisted with fewer children and get rich quickly is 10,000; Special assistance is given to families who only count the disabled and dead children of their only child.
Notes:
(1) Medical and health institutions include hospitals, primary medical and health institutions, professional public health institutions and other institutions.
(2) Public hospitals refer to hospitals whose economic types are state-owned and collectively run (including government-run hospitals).
(3) Private hospitals refer to hospitals other than public hospitals, including joint ventures, joint-stock cooperation, private hospitals, hospitals invested by Taiwan, Hong Kong, Macao and foreign countries.
(4) Primary medical and health institutions include community health service centers (stations), street hospitals, township hospitals, village clinics, outpatient departments and clinics (infirmary).
(5) Professional public health institutions include centers for disease prevention and control, specialized disease prevention and control institutions, maternal and child health care institutions, health education institutions, emergency centers (stations), blood collection and supply institutions, health and family planning supervision institutions, and family planning technical service institutions.
(6) government-run medical and health institutions refer to medical and health institutions organized by administrative departments such as health, education, civil affairs, public security, justice, and corps.
(7) Medical and health institutions of traditional Chinese medicine include hospitals, outpatient departments, clinics and scientific research institutions of traditional Chinese medicine, integrated traditional Chinese and western medicine and ethnic medicine.
(8) Health personnel include health technicians, rural doctors and health workers, other technical personnel, management personnel and workers and technicians. According to the statistics of the number of employees on the job, including those who are in the process of preparation, contract system, re-employment and temporary employment for more than half a year.
(9) Health technicians include practicing (assistant) doctors, registered nurses, pharmacists (doctors), technicians (doctors), health and family planning supervisors (including the number of civil servants who have obtained the certificate of health supervisor) and other health technicians.
(10) A practicing (assistant) physician refers to a person who has obtained a doctor’s practicing certificate and is actually engaged in clinical work, excluding a person who has obtained a doctor’s practicing certificate but is actually engaged in management work.
(11) Registered nurses refer to those who have obtained the certificate of registered nurses and are actually engaged in nursing work, excluding those who have obtained the certificate of practicing nurses but are actually engaged in management work.
(12) The number of health technicians, practicing (assistant) doctors, registered nurses, general practitioners, professional public health institutions and beds in medical and health institutions per thousand population is calculated according to the permanent population.
(13) Life expectancy per capita refers to the average number of years that a new group of people can live if the mortality rate of each age group remains unchanged. The data calculation is based on the life registration data of the National Health and Wellness Commission and the census data of the National Bureau of Statistics.